It’s no secret I’m a numbers geek. I believe if done correctly, stats tell us a great deal. So, I was quite surprised to see these results. After I collected all the data to determine the best month to sell your house I was blown away. Curious?

Ok, before we jump right in. A few things I’ve learned about home prices in my real estate career.
- Back in 2006, I knew more homes sold during the Summer months but I thought home prices moved ever so slowly higher, month after month after month. That’s wrong. That’s very wrong.
- By 2008, I now understood that these Summer months also returned greater home sale prices than even the months that followed that… same… year. Crazy, huh?
- Today in 2017, I (finally) decided to crunch the numbers to get a better grasp on the best month to sell your house. Here’s my mantra that’s similar to Papa John’s. More data, better results. Let’s go!
Before I began this article, I thought the average prices would be very similar to a standard Bell curve.
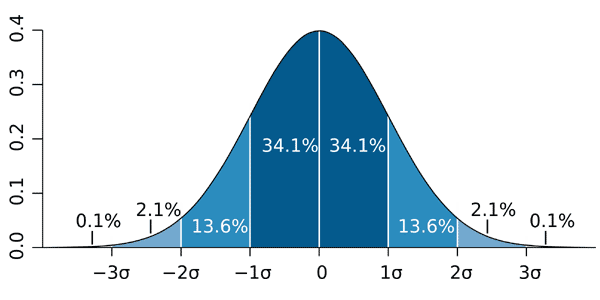
And I guess to a certain degree they are. But in many ways, these results are quite different. This next chart shows the monthly average for 9 years worth of data.
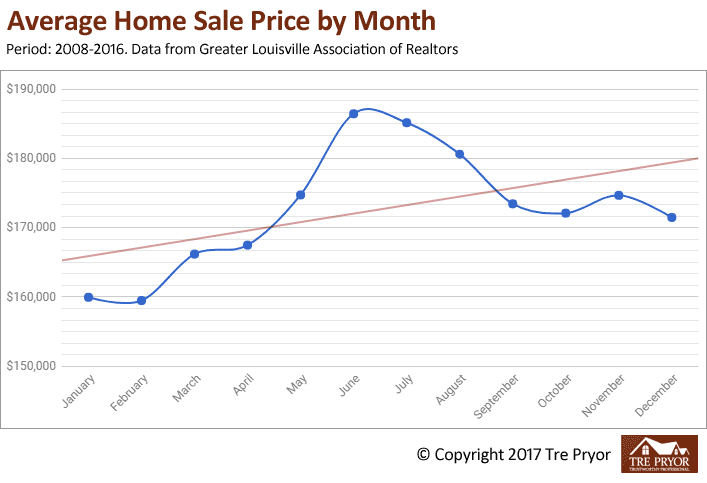
Where do I start? Here are the most surprising aspects of these findings:
- There’s a huge difference between December and January.
- Why is November higher than both September and October?
- I believed that May would be one of our higher months but it’s not truly much different than September through December.
So what does all this mean? Well, it means different things to home sellers than to home buyers. Pretty much the opposite as it turns out.
Let’s look at how each month compares to the yearly average.
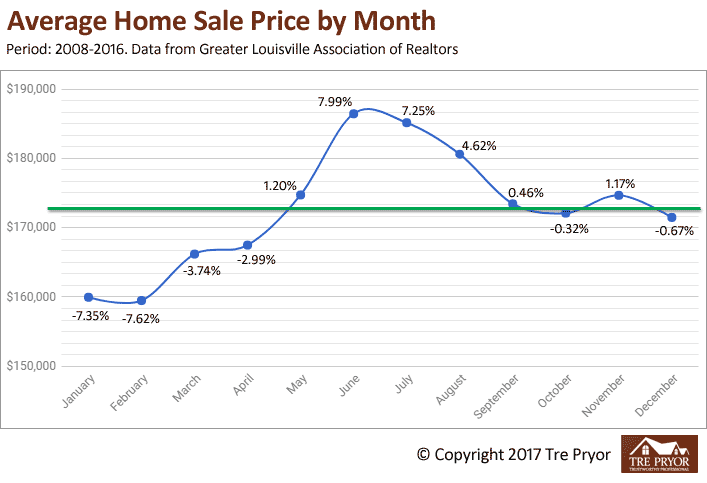
The green line is the average of all the averages. Then I compare each month to that line. And our findings…
Best Month to Sell Your House
- June: Top month by almost 8% over average!
- July: Just behind our leader, there were some years in our survey where July beat June.
- August: Coming in third is the month of August, as you would probably guess.
Worst Months to Seller Your House
- February: Even worse than January? Yup.
- January: Who is out looking at houses in this cold?
- March: I expected March to perform better than at least December… boy was I wrong.
Other Observations
- I really thought April would be higher. It’s the fourth lowest in our survey and that completely blew me away.
- What’s going on in November? I understand you don’t close on the house the day you start looking so we have to believe that these are buyers who started looking in the Summer and just didn’t find what they wanted until much, much later.
- The average for all of the June numbers in my report is $186,435. This number is 16.9% higher than the average for February. That’s remarkable! Sellers (and buyers as well) should know about this reality when it comes to selling your home for top dollar or buying your house at a true discount.